From the Papers: Paths into the Mary Baker Eddy Papers

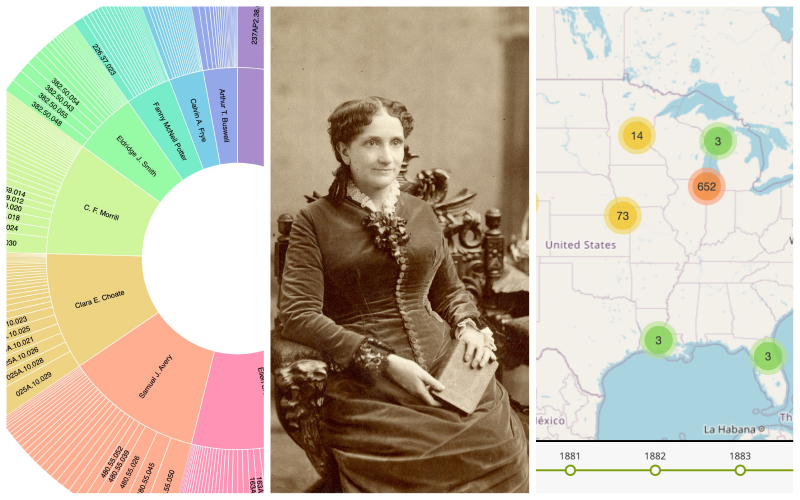
Studio portrait of Mary Baker Eddy, c. 1884. P00250. W. Shaw Warren
At the Mary Baker Eddy Papers we are always looking for new ways to help people access Mary Baker Eddy’s correspondence and manuscripts. For many people, searching by keyword or a familiar name can be an easy way in. For others, a more visual path is the one to follow. We’re now offering two such visual paths at mbepapers.org.
Mapping the Papers through space and time
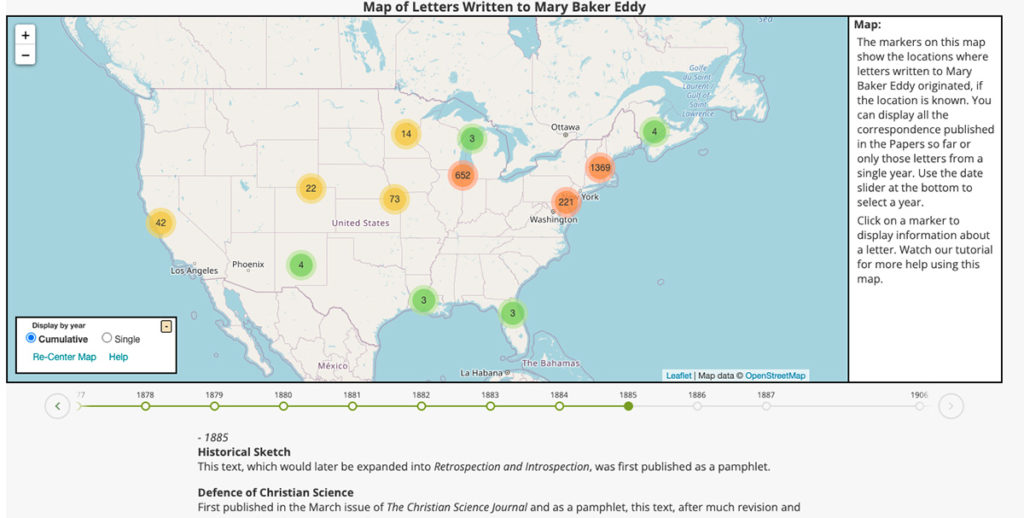
Our map of letters written to Eddy shows the locations, if known, where letters sent to her originated. After you click on “Access the Papers” on the homepage, you find this feature located under “Resources” on the side menu. You can display all the correspondence published by the Mary Baker Eddy Papers so far, or only letters from a particular year. Click a number on the map to explore letters that came from that area. Use the date slider at the bottom to select a year and watch the numbers of letters that Eddy received grow over time. You’ll notice the points of origin expand across the United States—and eventually beyond. Also listed below the map are major events in the history of Christian Science for each year, which can give insights into the topics addressed in the letters.
The map of letters on the Mary Baker Eddy Papers website.
Note that areas such as Chicago and Denver were clearly hotbeds for Christian Science. Other areas, like Petoskey, Michigan, show just a single letter—signifying the start of interest in Christian Science spurred by a single Eddy student.
Authors by volume of correspondence
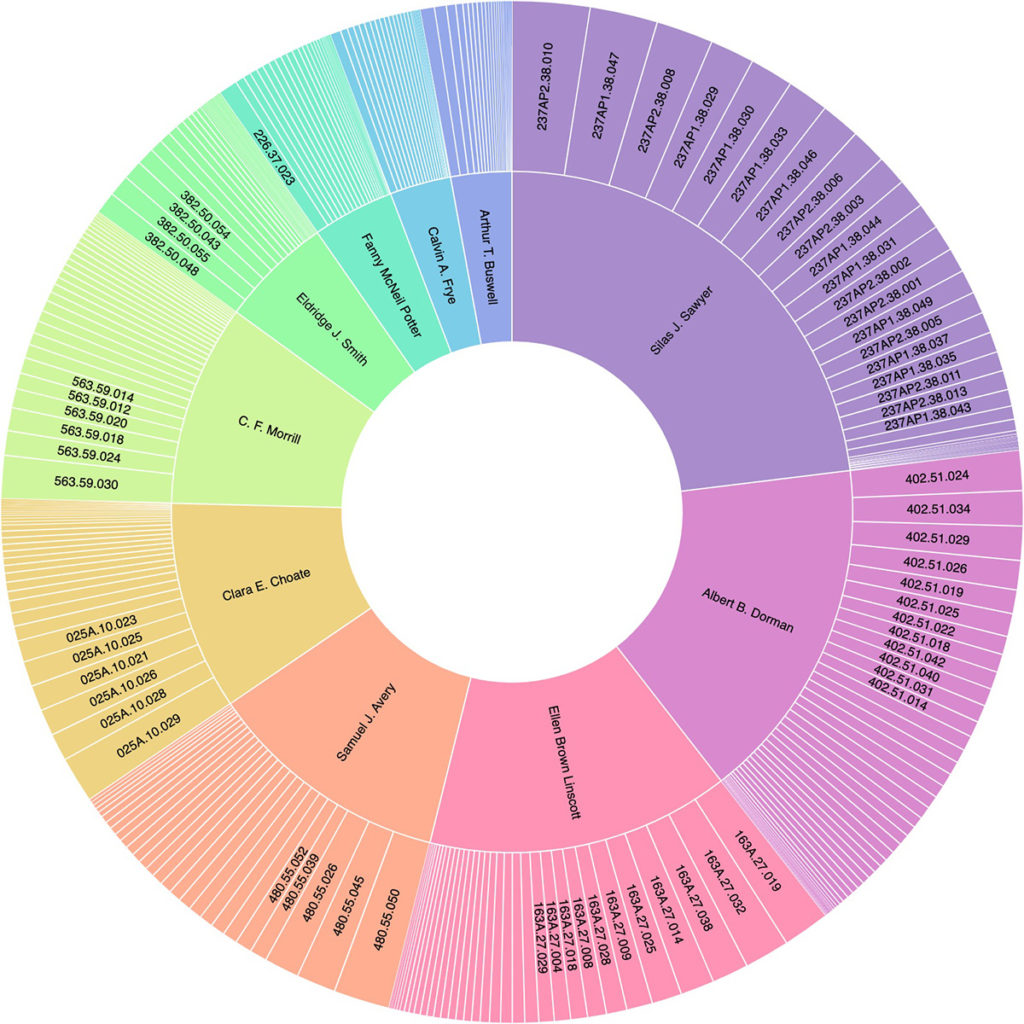
Explore our new sunburst diagram to see who wrote to Eddy the most (the current phase of the project includes letters sent to her through 1886). The size of each author’s section on the sunburst represents the number of letters he or she wrote. Click on an author to see their letters and then click on an accession number—each letter’s unique identifier—to open it.
The sunburst diagram on the Mary Baker Eddy Papers website.
There are a few considerations to keep in mind when drawing meaning from a diagram like this. First, it represents extant letters. Eddy’s secretary, Calvin Frye, was methodical in his role, saving the masses of letters that came in. However it is possible that there were a few that didn’t get saved. It’s also important to remember that an author may have been very prolific during a short period of time and is therefore overrepresented on this graph, which displays mostly letters up through 1886. By contrast, a long-term student may actually have ended up writing many more letters, although he or she did it over a longer period of time. That person may not therefore show up here as one of the most frequent correspondents.
For example, consider Samuel J. Avery. He was active in Christian Science for only a couple of years. At first glance, it appears that he was Eddy’s fourth most frequent correspondent, but note how the diagram changes if you switch the number of authors displayed from 10 to 20. Now you’ll see Caroline D. Noyes appear—a student of Eddy’s who ultimately had decades of impact on the growth of Christian Science. Noyes went on to write many letters to her teacher—far more than Avery.
Being mindful of these details, you’ll find this sunburst diagram offers an interesting visual representation of who Eddy was hearing from the most within specific snapshots of time. It’s possible that more meaning can be derived from looking at these letters in this way and investigating how they impacted the way she steered the Christian Science movement at different moments. Likewise, the incoming correspondence map offers a high-level view of how Christian Science spread across the United States, influencing each new area it entered and providing Eddy with a constant source of feedback as it traveled.
Both of these visual paths—the map of letters and the sunburst diagram—give us unique ways into Mary Baker Eddy’s papers.
You can watch video tutorials to learn more about using these features—there’s one for the map and another for the sunburst diagram. Find these tutorials on the Papers website, under “Resources.”


